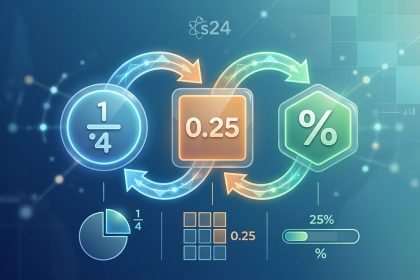
When you first see fractions, decimals, and percents, they might look like three separate languages. A sale price says 50% off. A recipe calls for 0.5 cups of milk. Your math homework asks for 1/2 of ...
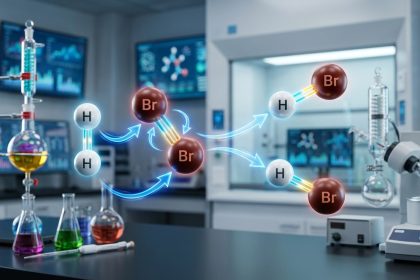
Chemical reactions are at the core of chemistry. They shape everything from the food we eat to the materials used in technology. A key part of these reactions is the movement of electrons. Without und...
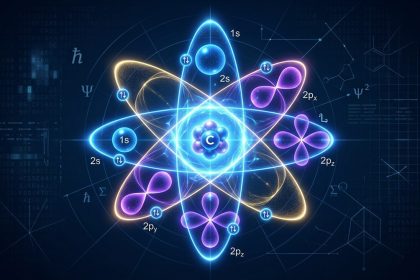
Atoms are the building blocks of matter. Understanding how electrons are arranged around an atom's nucleus is fundamental in chemistry. Atomic orbitals and electron configurations reveal the patterns ...
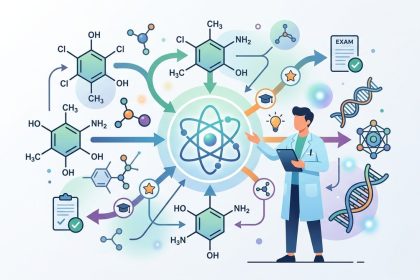
Organic chemistry can feel overwhelming at first. Reactions, mechanisms, and reagents seem like a foreign language. However, with the right approach, you can make mastering organic chemistry reactions...
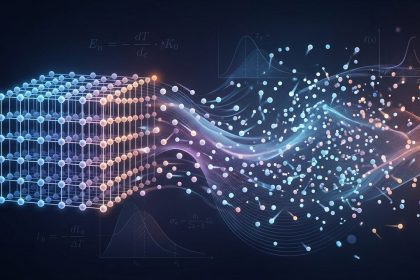
Entropy in modern physics is a fundamental concept that shapes our understanding of the universe. It’s a term often associated with disorder, randomness, and the inevitable progression of systems towa...
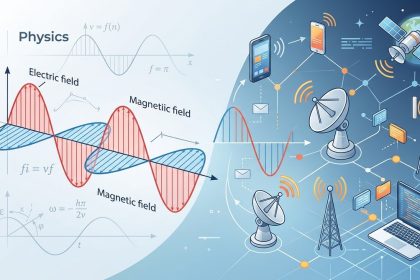
Electromagnetic waves are the invisible carriers of modern communication. They make it possible for your smartphone to connect to the internet, for satellite TV signals to reach your home, and for GPS...
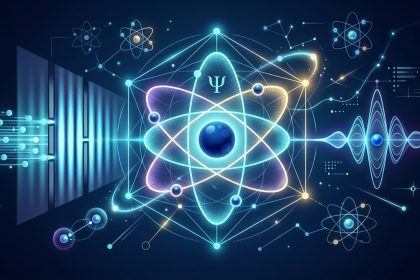
Quantum mechanics often sounds like a mysterious world reserved for scientists and advanced students. Yet, understanding its basics can be fascinating and surprisingly accessible. Whether you're a hig...

Calculus is often seen as a challenging branch of mathematics, but its core ideas become much clearer once you understand limits. Limits are the building blocks of many calculus concepts, including de...
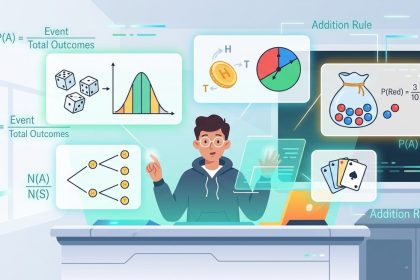
Probability is a fascinating branch of mathematics that helps us understand how likely events are to happen. Whether you’re trying to predict the weather, win a game, or understand data, knowing the f...
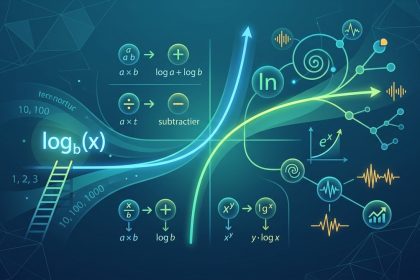
Starting to work with logarithms can feel intimidating at first. The good news is that with the right techniques, anyone can master the concepts. Logarithms are vital in many areas of science and math...